This is it. The last stop in our September series. We set out to walk you through everything we’ve shipped these past months, one theme at a time: heatmaps, AI, dashboards, and surveys. This week closes the loop with everything that makes Screeb easier and safer to actually run day to day.
From a command panel that puts all of Screeb one keystroke away to a dev panel for QA-ing your whole implementation with zero risk, this batch is about giving you more control with a lot less friction.
Command Palette Navigation
⌘ A New Navigation, One Command Away
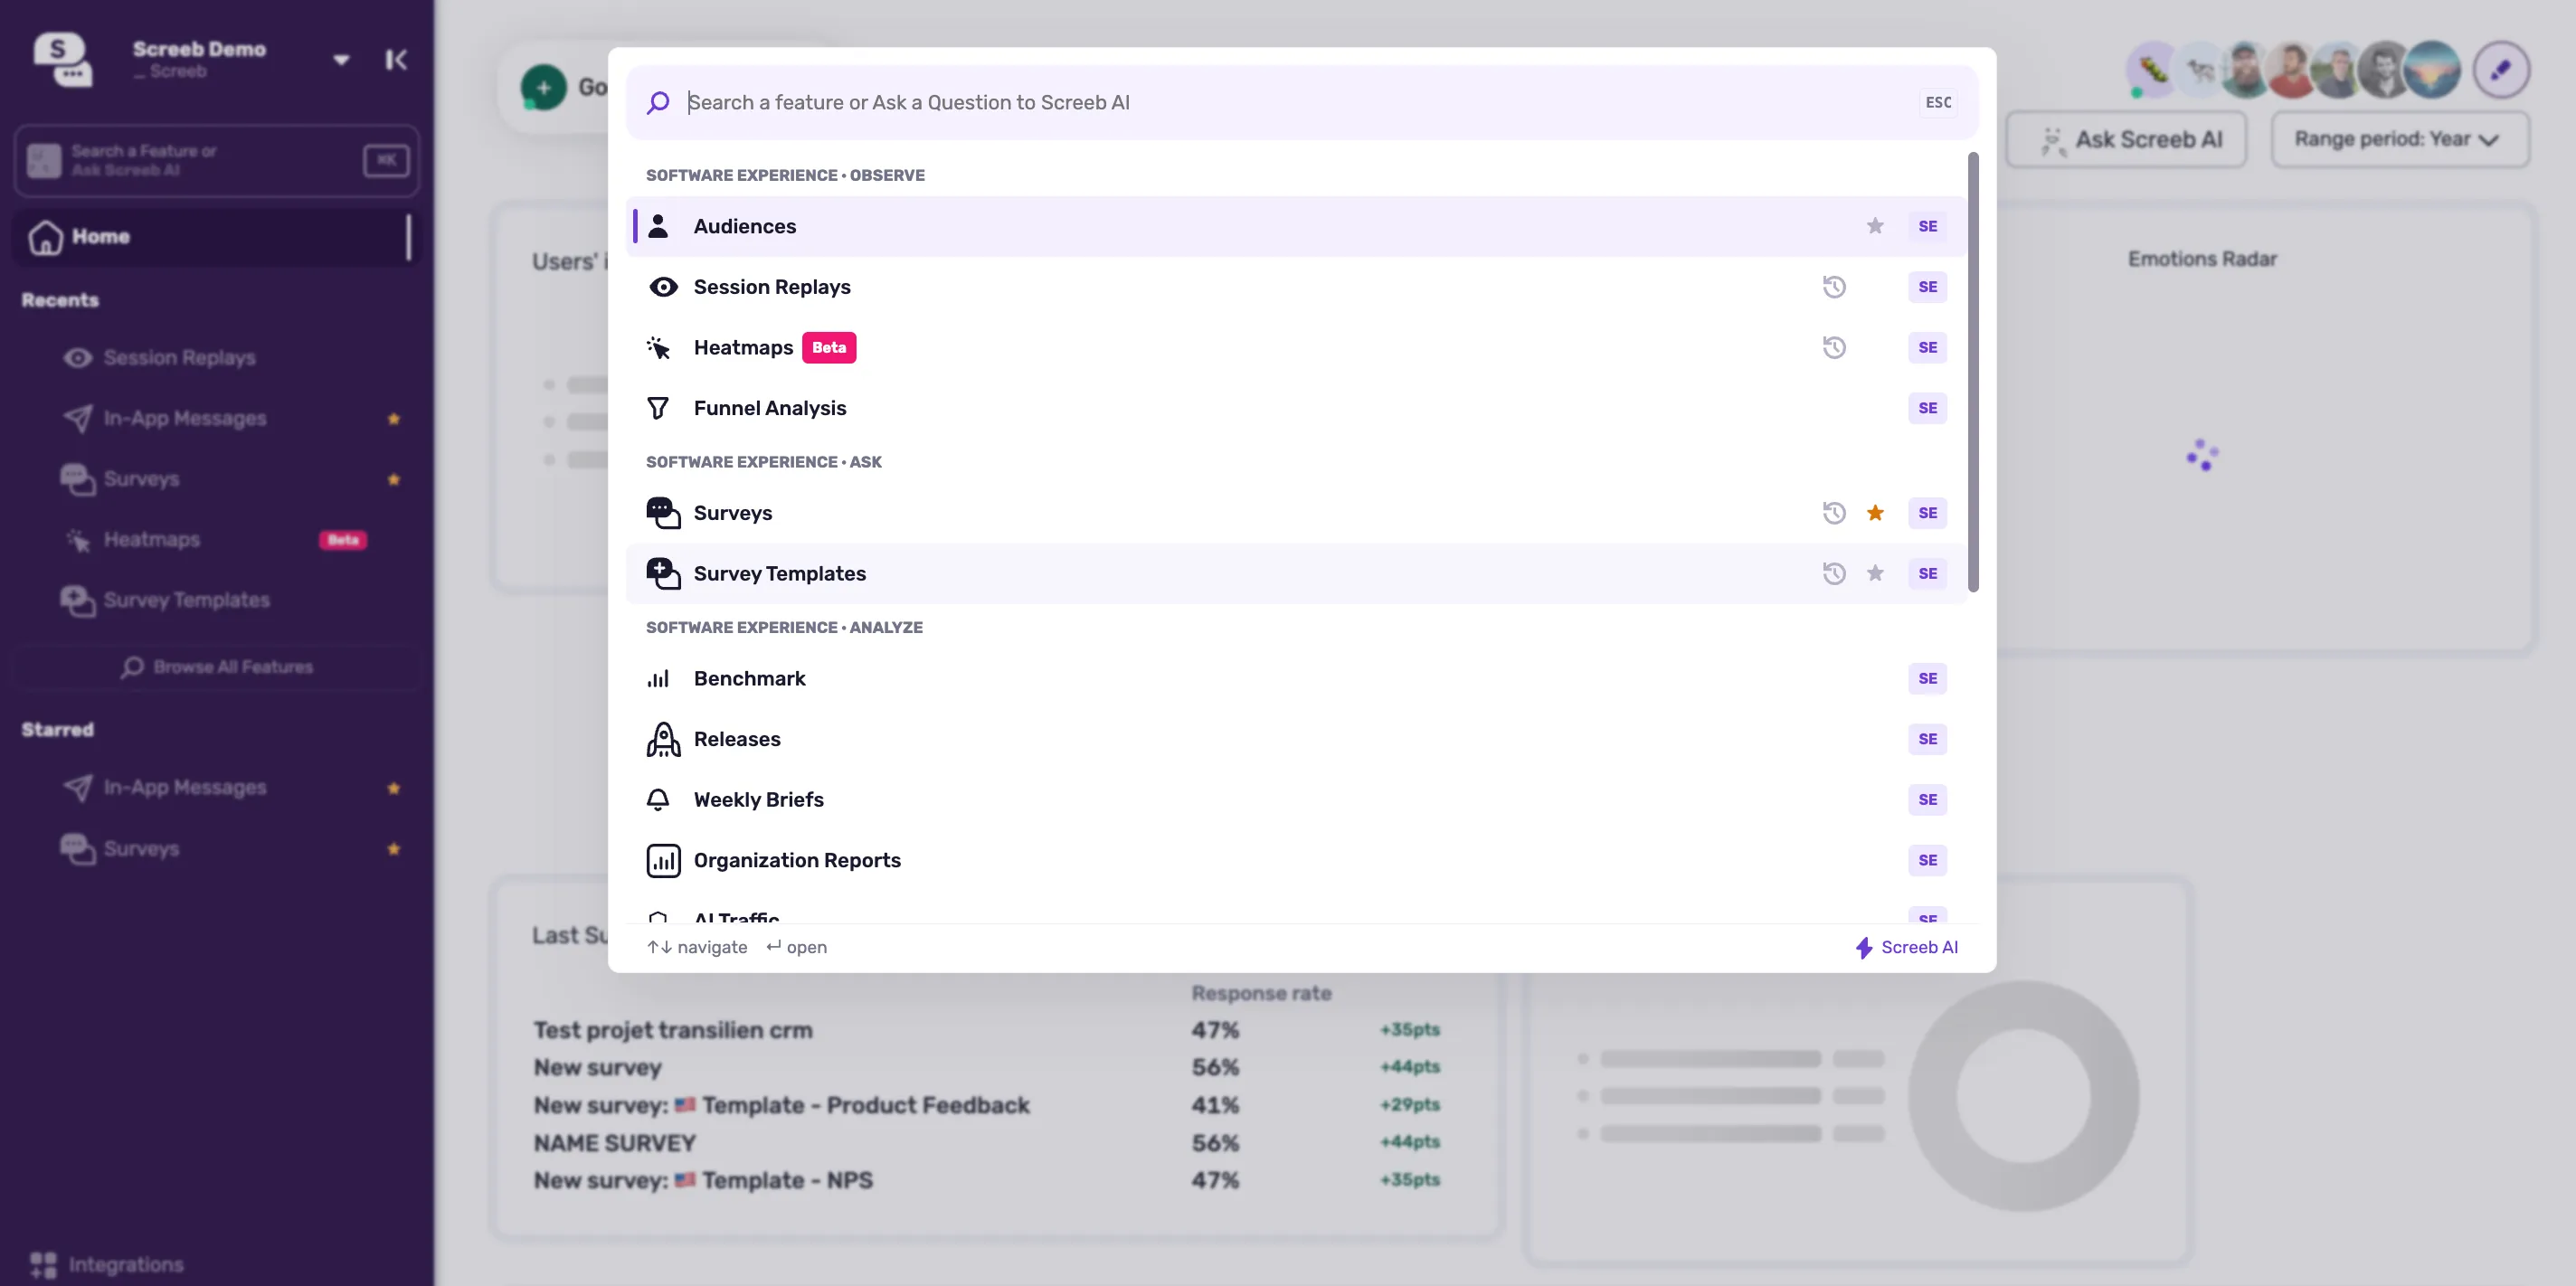
Screeb’s navigation has been fully redesigned around a single command panel. Hit ⌘K on Mac or Ctrl+K on Windows and it opens from anywhere in the product: type a few letters and jump straight to a survey, an audience, a dashboard or a setting — no more clicking through menus to find where something lives.
The same panel is also your entry point to Screeb AI, the assistant that answers questions on all the data in your workspace. Ask it directly from there, without leaving the page you’re on. One place to navigate, one place to ask.
Benefits:
- Reach anything in Screeb in a couple of keystrokes, from wherever you are
- Stop hunting through menus for features you use once a month
- Ask Screeb AI a question without breaking your flow
- The same navigation for everyone on your team, so onboarding a new user is quicker
Full Deletion Traceability
🗑️ Every Deletion, Fully Accounted For
A survey or segment disappears, and nobody remembers who removed it or why. That kind of blind spot is uncomfortable at best, and a real governance problem at worst.
Every deletion is now logged: who did it, what exactly was deleted, and when. If something goes missing, the answer is a lookup away, not a guessing game across the team.
Benefits:
- Full audit trail, always
- Investigate changes in seconds
- Real peace of mind for data governance
- No more “wait, who deleted that?” in the team chat
Screeb Inspector
🔍 Screeb Inspector: QA Your Whole Implementation, Live on Your Page
Checking a Screeb implementation used to mean publishing things live and hoping they behaved as expected — with real visitors as your test subjects. Not ideal, and definitely not something you want to do on production.
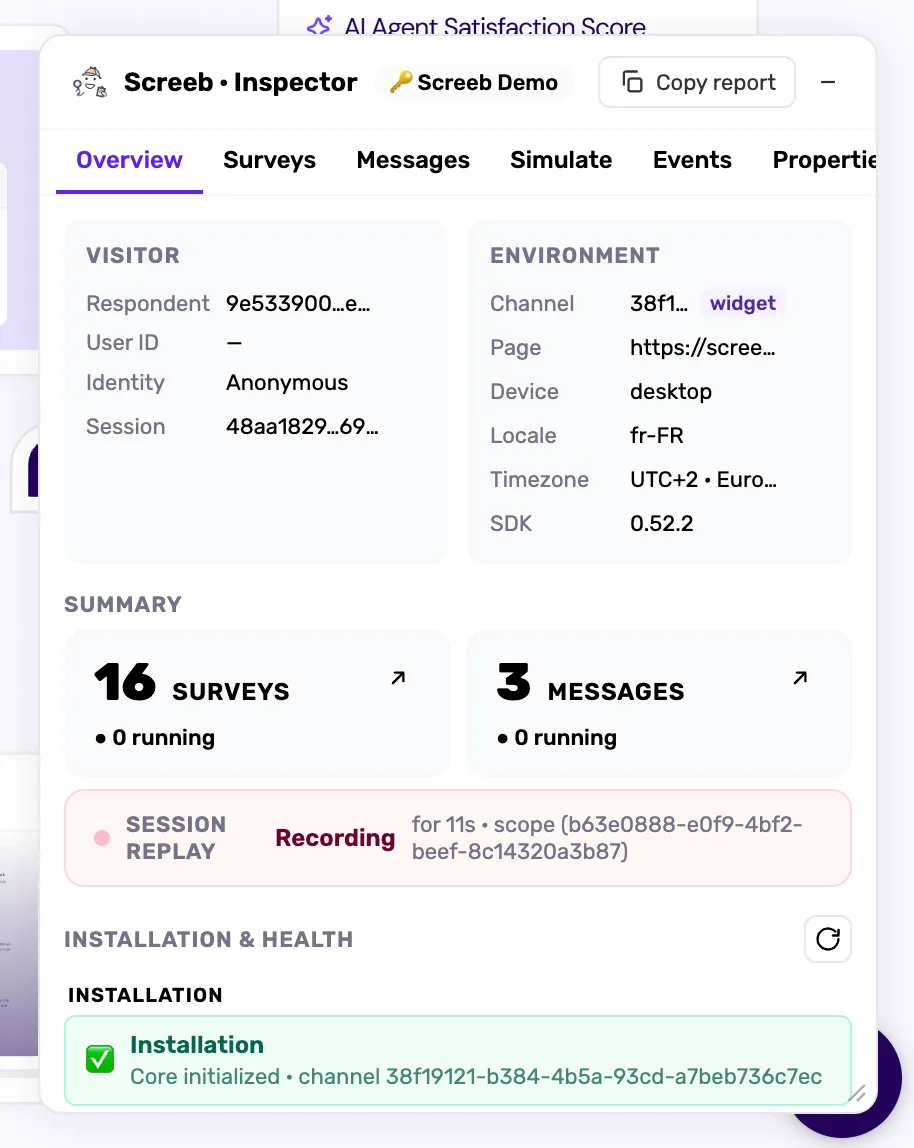
Screeb Inspector is a live dev panel that sits right on your page and shows you the actual state of everything running client-side: SDK installation and version, the visitor and session being tracked, environment details, events and properties as they fire, targeting rules and whether they match, surveys and messages currently eligible, session replay status. Everything you need to QA a setup end to end, with zero risk to what’s running for your visitors.
Benefits:
- Confirm your SDK is correctly installed and initialized, in seconds
- See exactly which events and properties reach Screeb — and which don’t
- Understand why a survey shows or doesn’t show, instead of guessing
- Validate a full implementation before go-live, not after your first user complains
Serve SDK From Your Own Domain
🔐 Serve the Screeb SDK From Your Own Domain
By default, the Screeb SDK loads from a Screeb URL. You can now serve it from your own domain instead rather than a third-party address.
Two things change. Security teams get a setup where everything running on your site is served from domains you control, which makes reviews and CSP policies much simpler. And because the SDK no longer comes from a known third-party domain, it stops being caught by browsers’ tracking protection and ad blockers — so you collect the responses you’d otherwise silently lose.
Benefits:
- Everything on your site served from domains you own, no third-party URL to whitelist
- Fewer blocked SDK loads, which means fewer missing responses and skewed results
- An easier conversation with your security and IT teams at review time
- Configure once, and it applies to every survey and message you run