Week three of the walkthrough we’ve been running all September. Over the past few weeks we’ve covered how you see your visitors and how you dashboard what matters. This week, we’re back to where it all starts: your surveys.
From a new way to measure effort to targeting that finally shows you real values instead of guesses, this batch is about running better feedback programs with a lot less manual work.
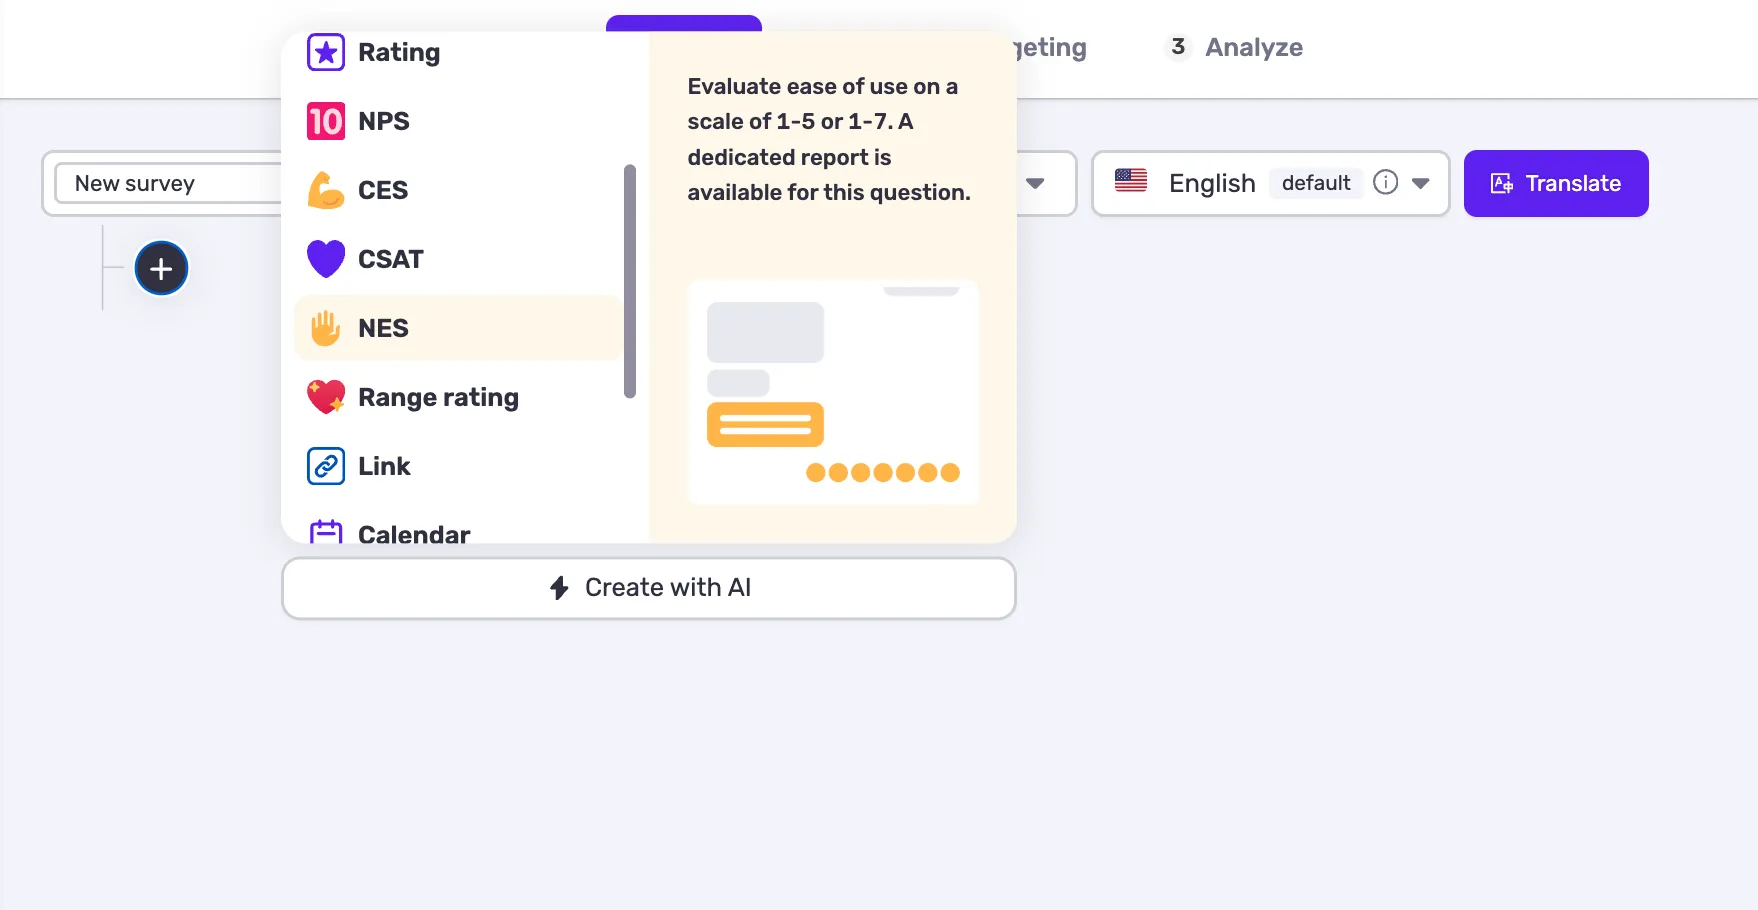
New NES Question Type
📊 Measure Effort With the New Net Easy Score (NES)
NPS tells you if people would recommend you. CSAT tells you if they’re happy. Neither tells you how hard something was to do — and effort is often the real reason people churn. Net Easy Score is a new question type built specifically to capture that.
It works like this: right after a key step, you ask users how easy or difficult the experience was, on a 1-to-7 scale. Responses split into three groups — Easy (6-7), Neutral (5) and Difficult (1-4) — and your NES is the percentage of Easy answers minus the percentage of Difficult ones. One number, between -100 and +100, that tells you whether your product is getting easier or harder to use.
Add the question to any survey and the dedicated dashboard comes preconfigured — no setup, no custom report to build. You get your NES trend over time and can drill down to the exact steps creating friction.
Benefits:
- A metric built for effort, where NPS and CSAT only capture recommendation and satisfaction
- A single score you can track over time and compare across journeys
- Pinpoint exactly which steps are painful, instead of knowing only that something is
- Runs alongside your existing NPS and CSAT surveys for a fuller picture
Finer Survey Scheduling
🗓️ Finer Control Over Your Survey Schedule
Recurring surveys already let you set a rhythm — asking a question every 90 days, for instance. What’s new is the level of control over when they can actually show up.
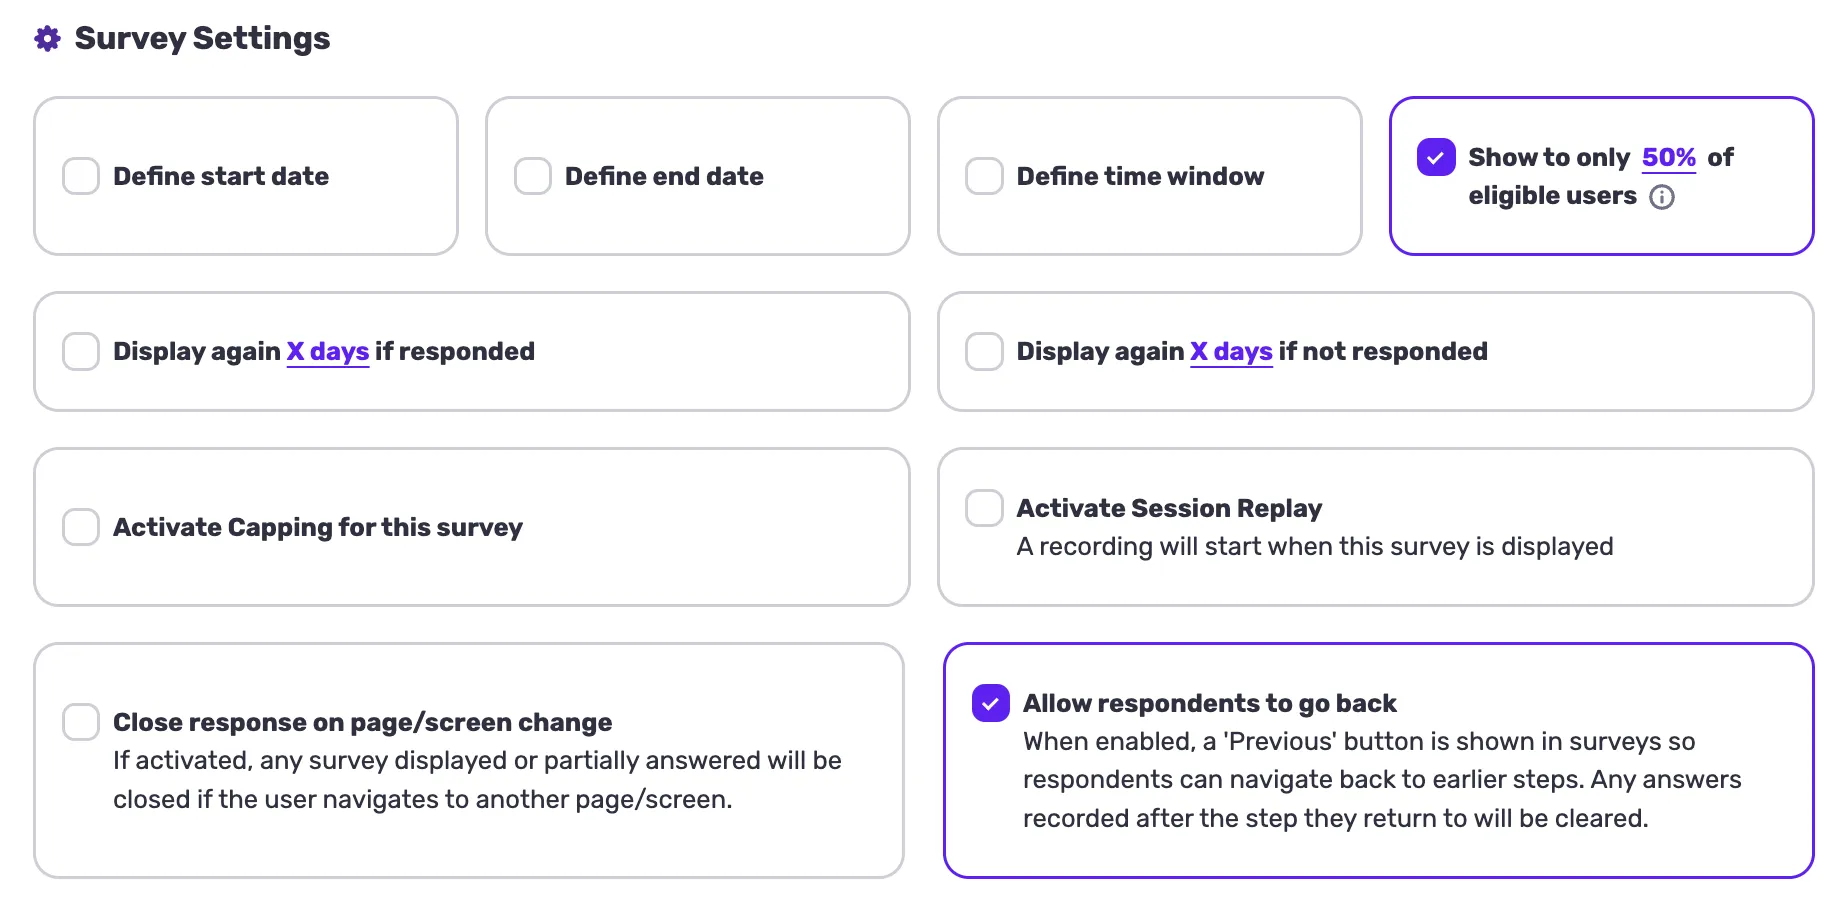
You can now define display slots day by day: Mondays from 9 to 6, nothing on Tuesdays, Wednesdays from 2 to 5. Your survey only appears inside the windows you’ve chosen, and keeps running on its own from there.
Benefits:
- Catch users when they’re actually available, not at 3am on a Sunday
- Keep responses concentrated on your business hours, so your team can follow up while it’s fresh
- Avoid periods you know will skew your results — weekends, holidays, release days
- Set the schedule once and let the program run without anyone watching the calendar
Sampling-Based Targeting
🎯 Show Your Survey to a Representative Sample of Your Users
On a high-traffic page, showing a survey to everyone doesn’t get you better data — it gets you survey fatigue and lower response quality. You don’t need every user to answer to know what your audience thinks: a sample is enough, as long as it’s drawn properly.
Set a percentage and Screeb shows your survey to exactly that share of your targeted audience, drawn at random and stable over time — the same visitor always gets the same treatment. The result is a representative sample of the audience you targeted, with a fraction of the solicitation.
Benefits:
- Protect your audience from over-solicitation without giving up on measuring
- Results that reflect what your targeted audience thinks, not just who happened to be shown the survey
- Consistent data over time, since a given visitor always stays in or out of the sample
- Roll out gradually: start at 10%, check the response quality, then scale up
Enriched Slack Notifications
💬 Slack Alerts That Actually Give You Context
A bare “new response received” notification tells you almost nothing, you still have to open the admin, find the response, and piece together who it was and what device they used.
New response notifications now come loaded: a direct link straight to the response, plus device and browser info, right there in the Slack message.
Benefits:
- Jump straight into context from Slack
- No detour through the admin
- Faster team reactions, every time
- Everything you need to act, without leaving Slack
KPI Reports Exportable to Notion
📤 Your KPIs, Right Where the Team Already Works
NPS, CSAT, CES and NES numbers are only useful if the team actually sees them, and screenshotting a dashboard for the weekly update is a habit that quietly dies after a few weeks.
Those reports can now be sent straight into Notion, wherever your team already tracks its work, so trends stay visible without anyone doing manual copy-paste.
Benefits:
- One reporting hub for the whole team
- No more manual copy-pasting
- Share trends with stakeholders effortlessly
- KPIs that stay part of the conversation, not buried in a dashboard
Custom Closing Rules per Survey
🚪 Decide Exactly How and When a Survey Closes
Every survey used to follow the same closing behavior, which meant compromising: what made sense for one survey wasn’t right for the next. You now get a set of rules to define that behavior survey by survey.
You decide what happens when someone leaves a survey partially answered, and what happens when they change page or navigation context: the survey keeps running, or it closes — and whether it’s hidden or fully closed. Same product, different rules, depending on what each survey and each audience actually needs.
Benefits:
- Set closing behavior that fits each survey, instead of one setting for all of them
- Keep partial answers from being lost when that’s what you want
- Avoid surveys following users into a context where they no longer make sense
- Fewer interruptions on the respondent side, cleaner data on yours