The past few months have been intense on our end. We’ve been shipping at a pace we’re genuinely proud of — new ways to see your visitors, target them, bring AI into your daily workflow, and build the dashboards you actually need. There’s simply too much to fit in one email, so this September, you’ll be hearing from us every week, one theme at a time.
None of this happened in a vacuum. A good chunk of what’s coming was shaped directly by conversations with you — and some of you even got early access and beta-tested these exact features with us over the past few weeks. That’s the whole point of building Screeb the way we do: we move faster, and we ship more, because we build it with you, not just for you.
First up: three ways to actually see what your visitors are doing, and act on it immediately.
Heatmaps
🖱️ Heatmaps Are Now Available for Everyone
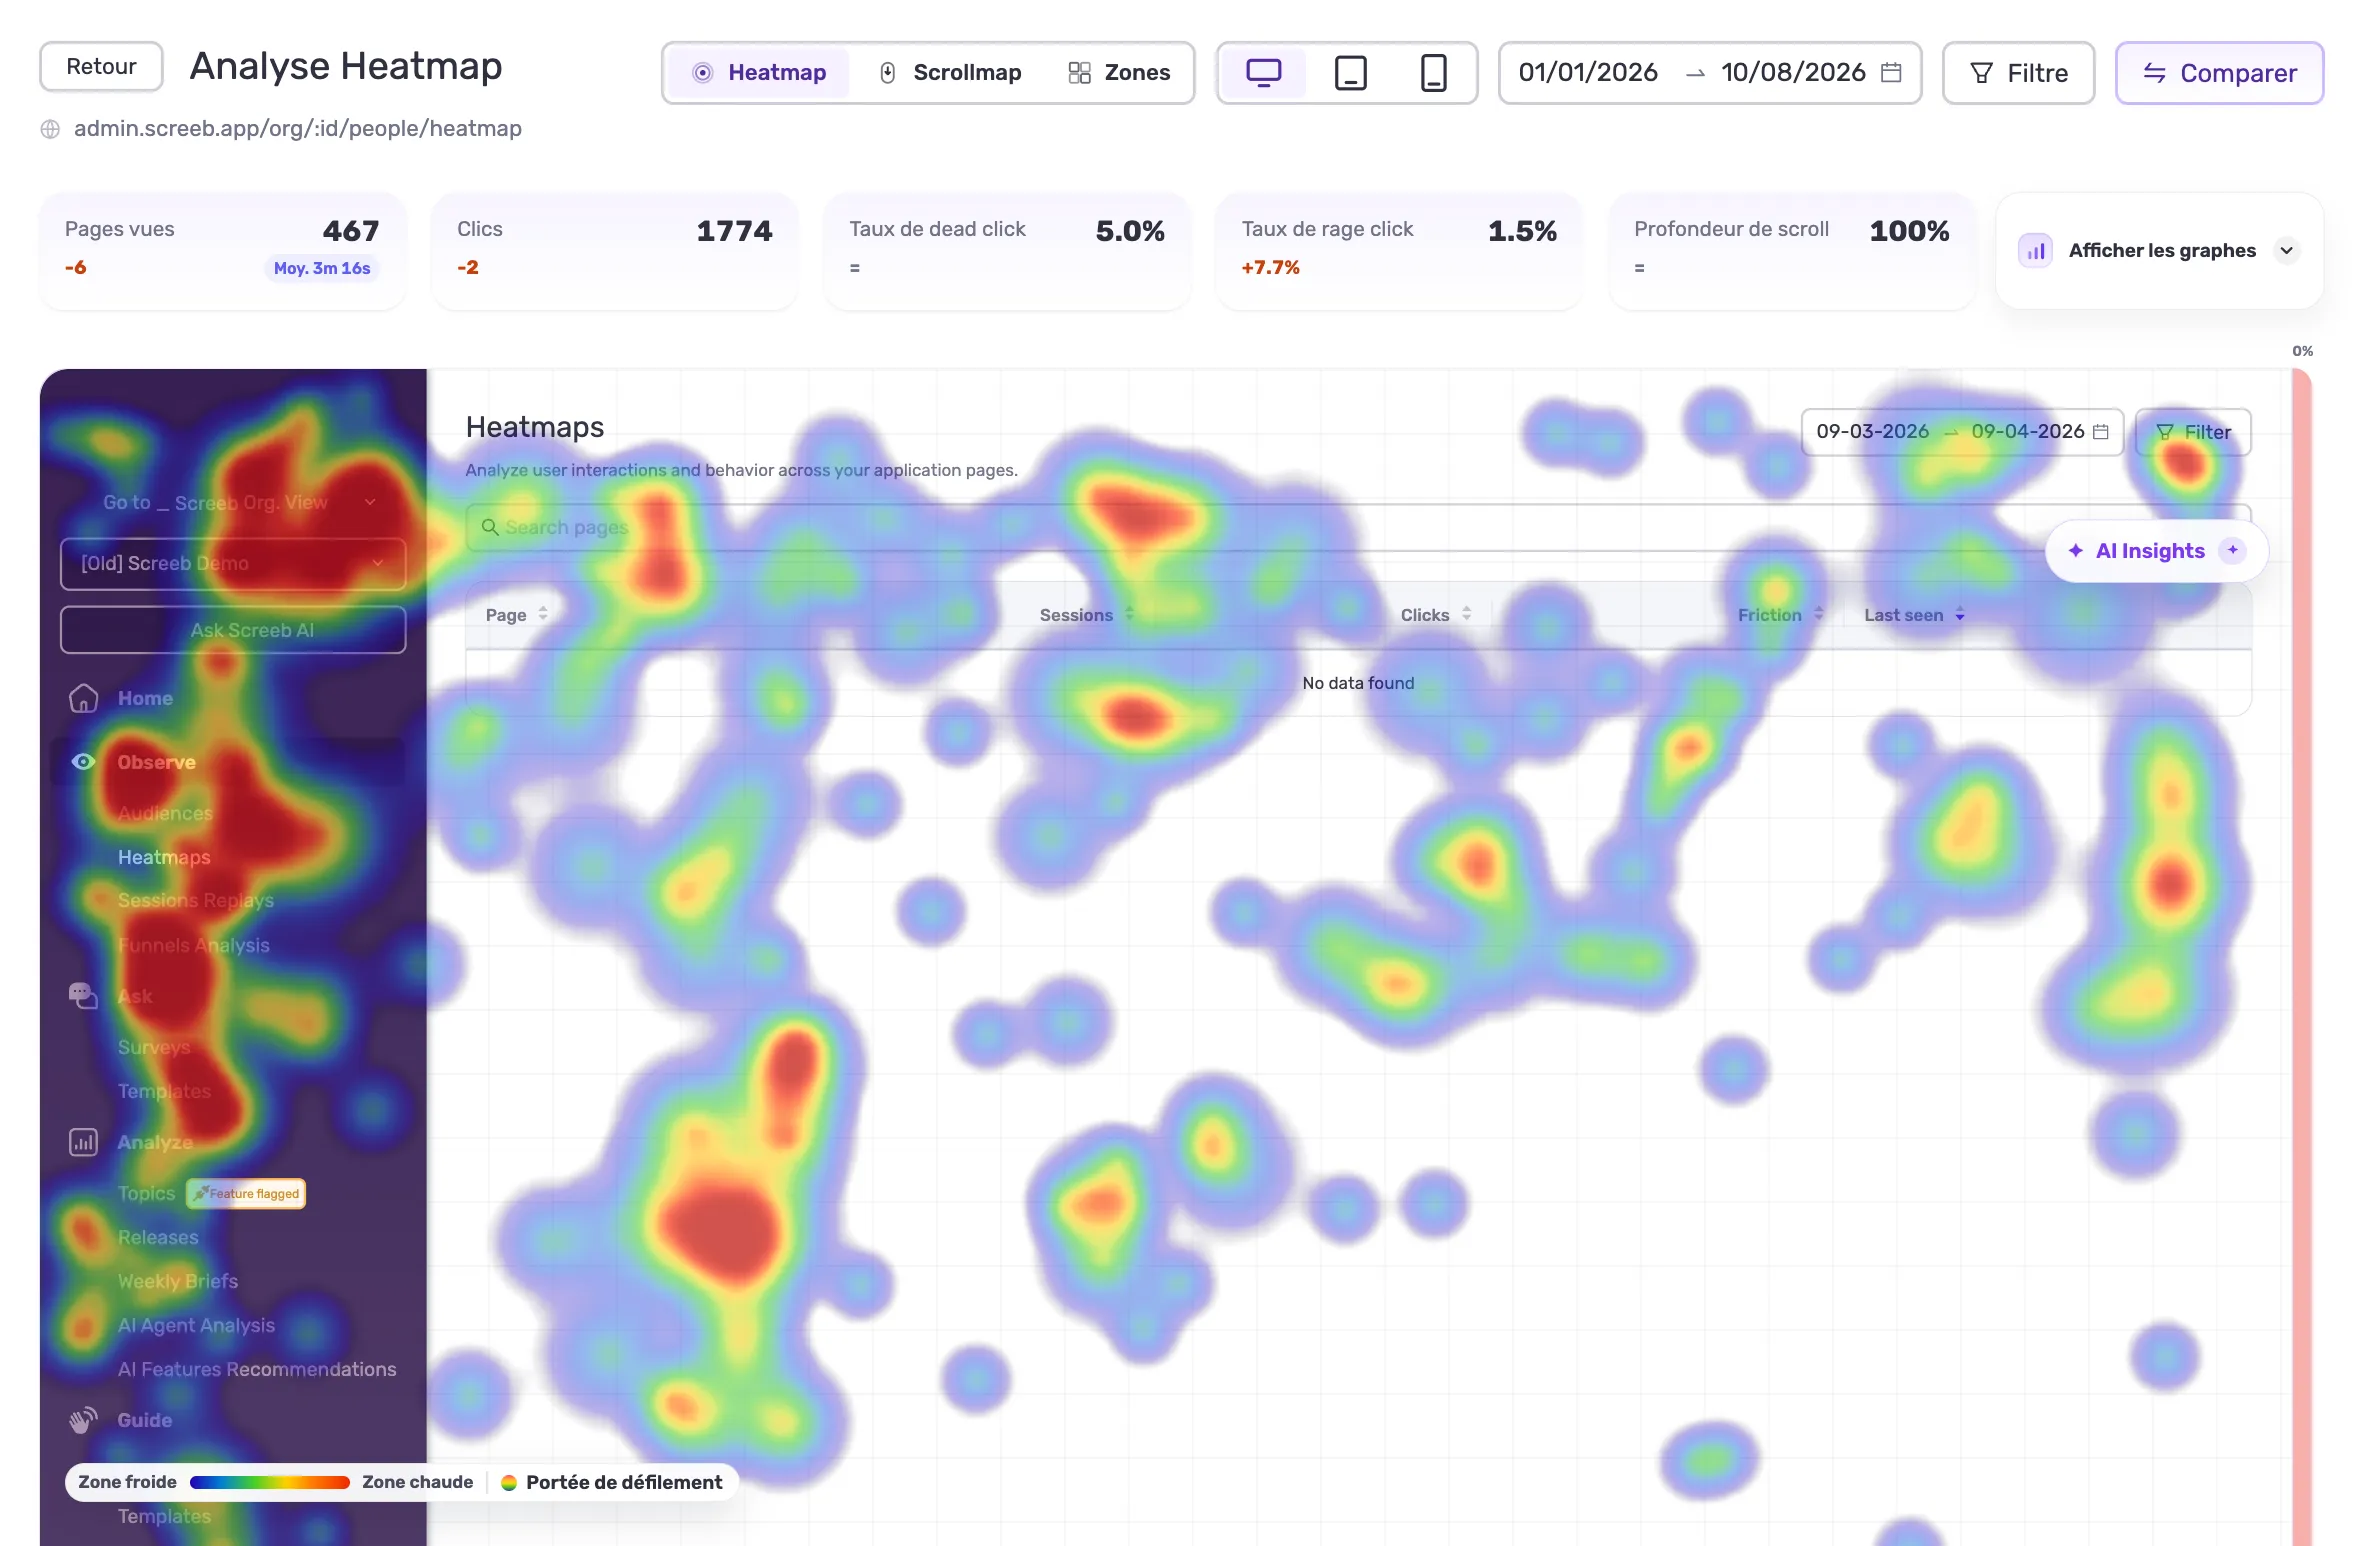
A heatmap shows you at a glance where your visitors click, scroll and pause on each of your pages: the zones that grab attention, the ones that get ignored, the ones that create friction. It’s the starting point for understanding what really works in your experience, without waiting for a report or a meeting.
But at Screeb, a heatmap doesn’t stop at the image. On a hot zone, you open the corresponding session replays directly to see what visitors experienced before and after that click. And on the key spots you identify, you trigger a survey or a product tour, exactly where it matters, on any page of your product or website. One single platform to observe, understand and act.
Benefits:
- See instantly where attention (and friction) really is on any page
- Jump from a hot zone straight to the matching session replays for full context
- Trigger a survey or product tour on the exact spot that matters, no separate tool needed
- Available on every plan, no more beta
Zoning
🗺️ Zoning: Measure the Performance of Every Zone
With zoning, you draw the zones that matter on a page yourself: a button, a block, a banner, a section. You then track their performance individually, not just clicks, but everything that happens next, all the way to conversion and revenue generated by each zone.
It’s no longer “this page got clicked here,” it’s “this button drove X conversions and $Y in revenue.” A powerful tool to compare, page by page, block by block, what actually pays off, and focus your efforts where it counts.
Benefits:
- Define your own zones on any page, no dev needed
- Track clicks, conversion and revenue per zone, not just per page
- Compare blocks and sections to see what actually drives results
- Prioritize your roadmap based on real business impact, zone by zone
“Watch replay” button
▶️ Every Response, With Its Full Context
Now, on every response collected through a survey, a “watch replay” button takes you to the corresponding session in one click. You’re no longer stuck with an isolated number or comment: you see everything the person experienced before, during and after they responded.
Feedback and behavior, reunited in one place, so you understand not just what your users say, but what they actually live.
Benefits:
- One click from any survey response to its exact session replay
- See the full journey: before, during and after the feedback
- No more guessing what a rating or comment actually means
- Feedback and behavioral data finally in the same place